SignalsAPI Labs · September 2026
SignalsAPI AI-Engineering Demand Cut
How employer demand splits across the engineering specialisms — one filtered cut of the corpus per specialism, ranked by deduplicated posting volume.
Method v1.11.0 · Generated September 01, 2026 · how we measure
222,760
deduplicated postings in the last 7 days
+110.8% vs the prior period (105,659)
AI and machine-learning roles are advertised alongside — not instead of — the data and platform work that puts them into production, so demand for the surrounding specialisms moves with them rather than against them.
Demand by cut
| Cut | Postings |
|---|---|
| Platform & reliability devops · site reliability · platform engineer · sre | 593 |
| AI & machine learning ai engineer · machine learning · ml engineer · deep learning · llm | 473 |
| Data engineering data engineer · analytics engineer · etl | 405 |
| Data science data scientist · data science | 355 |
| Security engineering security engineer · application security · appsec | 291 |
Terms are matched against a posting's job title, case-insensitively and on a word boundary — so “llm” matches “LLM Engineer” and not “fulfillment”. They are not matched against the description of the posting: the corpus surface these pages are built from carries a posting's title, company, location and salary but not its body text, so a posting whose body mentions a term under an unrelated title is not counted. Every list below therefore understates its term's true incidence, in the same direction and for the same reason. Each list was frozen before this edition was cut — see the pre-registered term lists for the dates and why each term is on it.
AI & machine learning by industry
Software & IT leads: 1.43% of the postings advertised in it name an AI or ML title.
Each sector's figure is the share of that sector's own advertised postings, so the sectors are comparable to each other even though we hold an industry label for only some employers. It is not a share of all postings, and it is not a count.
| Sector | AI/ML share | Matching | In sector |
|---|---|---|---|
| Software & IT software · information technology · it consulting · computer hardware · computer networking | 1.43% | 68 | 4,767 |
| Financial services financial services · banking · insurance · capital markets · investment management | 1.14% | 26 | 2,287 |
| Healthcare & life sciences hospital · health care · healthcare · pharmaceutical · biotechnology · medical device | 0.39% | 14 | 3,558 |
| Manufacturing & industrial manufacturing · automotive · machinery · industrial automation | 0.23% | 11 | 4,809 |
| Retail & consumer retail · wholesale · consumer goods · food and beverage | withheld | — | — |
| Telecom, media & entertainment telecommunications · broadcast media · publishing · entertainment · advertising services | withheld | — | — |
| Government, education & research government · education · research services · defense | withheld | — | — |
| Professional & business services management consulting · legal services · accounting · engineering services · human resources | withheld | — | — |
Industry groups are matched against the industry label the source itself publishes for the employer, case-insensitively and as a substring — so “software” matches “Software Development”. Substring matching is looser than the word-boundary rule used for job titles, which is why every term below is a phrase specific enough that no unrelated label contains it. A label may match more than one group; each group is measured against its own postings, so an employer counted in two groups is counted correctly in both rather than twice in one.
Industry labelling covers 67.22% of the deduplicated postings these pages render (measured 2026-07-22). That coverage is not evenly distributed: it is 88.81% on our largest single source and 31.55% across every other source combined, and two national corpora carry almost no industry labels at all. So counting postings per industry and ranking the industries would largely rank which sectors our best-labelled source happens to cover. Any figure we publish by industry is therefore a rate measured inside a sector — the same labelled population in the numerator and the denominator — never a share of the whole corpus, and it excludes every posting whose employer carries no industry label.
The aggregate file carries every figure above. The row-level file carries the postings they were counted from, and states per cut whether it lists all of them or the most recent sample. Attribution required.
Cite this study
SignalsAPI Labs, “SignalsAPI AI-Engineering Demand Cut”, September 2026. jobs.signalsapi.com/ai-engineering-demand
Embed this chart
Paste this anywhere. The chart is a single image served from this site, so it carries no scripts and needs no plugin — and it redraws itself when the next edition publishes, with no edit on your side. Attribution is baked in; the link back is required by the licence.
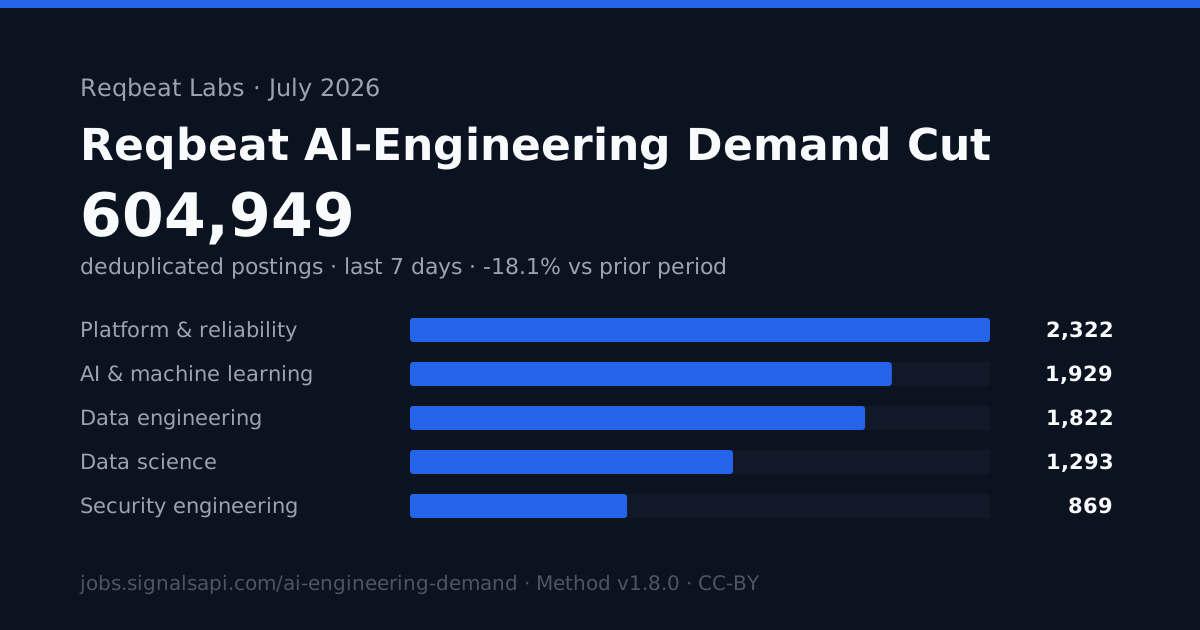
<a href="https://jobs.signalsapi.com/ai-engineering-demand?surface=embed"><img src="https://jobs.signalsapi.com/ai-engineering-demand-embed.svg" alt="SignalsAPI AI-Engineering Demand Cut — September 2026 edition, published by SignalsAPI Labs" width="600" height="315" loading="lazy"></a>
<p>Source: <a href="https://jobs.signalsapi.com/ai-engineering-demand?surface=embed">SignalsAPI AI-Engineering Demand Cut — SignalsAPI Labs</a>, September 2026. Licensed CC BY 4.0.</p>
Query the corpus this study was cut from
Every figure here is a query over the same live hiring-signal corpus the API serves — today's postings rather than this month's snapshot.
Get my 10 free signals →Live hiring pages behind this study
Live hiring pages cut from the same corpus, refreshed every three hours — this study is the monthly print of it.
Methods Box
- What was counted
- Every figure below is a count of deduplicated postings — one row per company, job title and country, per the rule below — over the stated window.
- Sample
- We measure the volume of online job postings we observe, deduplicated to one row per company, job title and country, across 55 distinct sources, over a rolling 30-day window.
- Deduplication
- Repeat and re-posted advertisements collapse to a single row per (company, job title, country). Where several postings share that key, we keep the most complete one — the row that resolves to a named company with an industry, headcount and location — and break remaining ties by the most recent posting date. Note the key is country, not city: two postings for the same role in two cities of one country count once, and the same role in two countries counts twice.
- Privacy floor
- No published cell describes fewer than 5 distinct companies.
- What it does not measure
-
- Employment levels, hires, or separations. This is a posting-volume measure, not an establishment survey — it is not comparable to, and does not estimate, the figures BLS publishes.
- Vacancies that are never posted online, filled internally, or filled through a network without a public advertisement.
- Postings behind a login, a paywall, or an application flow we do not crawl.
Full methodology, frozen and versioned: jobs.signalsapi.com/method (v1.11.0).